
Previous Story
EUR/USD: plan for the American session on May 19, 2020
To open long positions on EURUSD, you need:
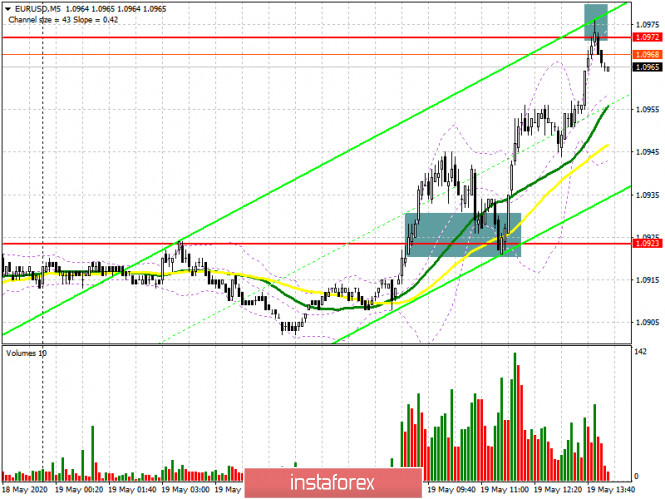
Data on the ZEW indices of Germany and the Eurozone today provoked another wave of growth of the European currency against the US dollar because, despite their leading indicators, they were much better than the forecasts of economists. If you remember my morning forecast, I recommended opening long positions after a breakout and fixing above the level of 1.0923. On the 5 minute chart, after the breakout of the resistance of 1.0923, its reverse test took place from top to bottom on the volume, which served as the reason for opening long positions in the expectation of continued upward correction (which brought more than 50 points of profit). The bulls completely coped with their task and reached the level of 1.0972, which I also mentioned, where profit-taking took place. At the moment, the task of buyers for the second half of the day will be to break through and consolidate above this range, which will lead to further strengthening of EUR/USD to the highs of 1.1013 and 1.1093, where I recommend closing long positions. In the scenario of the pair’s decline, and during the North American session, Federal Reserve Chairman Jerome Powell is expected to speak. You can expect to open long positions immediately on a rebound from the morning level of 1.0923 or buy EUR/USD from a larger minimum of 1.0886, where the moving averages are held.
To open short positions on EURUSD, you need:
Sellers showed themselves after the resistance test of 1.0972, but so far there is no active decline in the euro from this level. In case of breakdown and consolidation above this range in the second half of the day, it is best to abandon short positions prior to the upgrade larger high of 1.1013 or sell euros immediately on the rebound from the resistance of 1.1093, based on a correction of 30-40 points intraday. Another important task of the bears for the second half of the day will be to return and close the trading day below the level of 1.0923, since only then can we talk about the resumption of pressure on the European currency, which will push the pair to the lows of 1.0886 and 1.0855, where I recommend fixing the profits. For now, the bears can only count on Jerome Powell’s performance.
Signals of indicators:
Moving averages
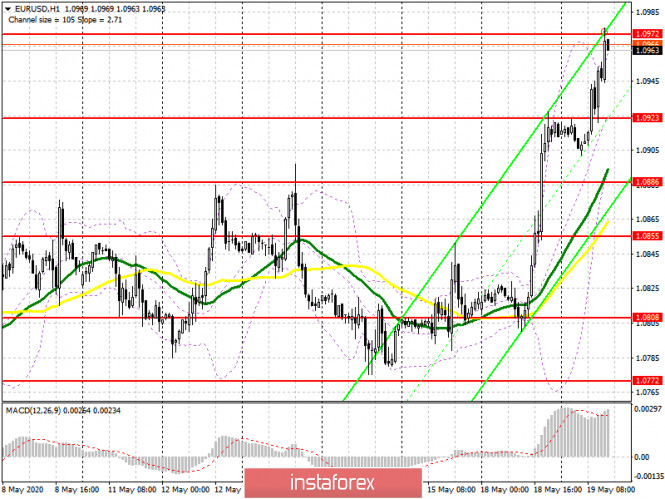
Trading is conducted above the 30 and 50 daily moving averages, which indicates the bullish nature of the market.
Note: The period and prices of moving averages are considered by the author on the hourly chart H1 and differ from the general definition of the classic daily moving averages on the daily chart D1.
Bollinger Bands
In case of a decline, the average border of the indicator around 1.0923 will provide support, but it is best to buy euros for a rebound only after testing the lower border of the indicator in the area of 1.0886.
Description of indicators
- Moving average (moving average determines the current trend by smoothing out volatility and noise). Period 50. The graph is marked in yellow.
- Moving average (moving average determines the current trend by smoothing out volatility and noise). Period 30. The graph is marked in green.
- MACD indicator (Moving Average Convergence / Divergence – moving average convergence / divergence) Fast EMA period 12. Slow EMA period 26. SMA period 9
- Bollinger Bands (Bollinger Bands). Period 20
The material has been provided by InstaForex Company – www.instaforex.com


