
Previous Story
EUR/USD: plan for the European session on Dec 9, 2019
To open long positions on EURUSD, you need:
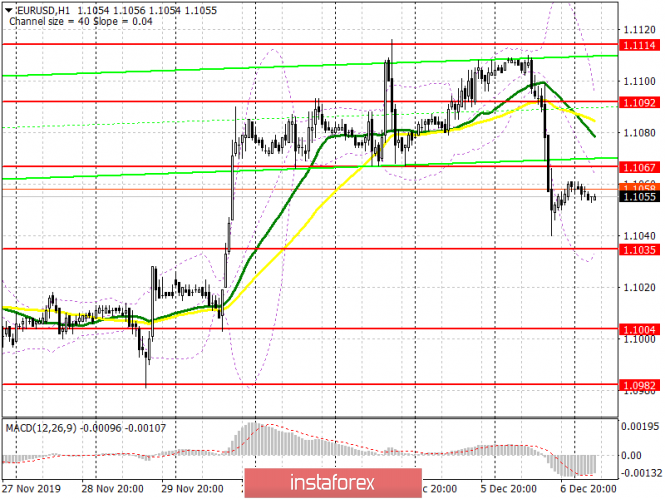
Data on the US labor market, which was much better than economists’ forecasts, strengthened investors’ confidence that the Federal Reserve will no longer lower interest rates this year. This fact led to a sharp increase in the US dollar. At the moment, buyers of the euro need an urgent return to the resistance level of 1.1067, as it depends on it whether the downward movement will continue or not. If bulls fail to do this in the first half of the day, it is best to postpone purchases until the formation of a false breakout in the support area of 1.1035, but it is best to buy EUR/USD immediately on the rebound from the minimum of 1.1004. The breakout and consolidation of the euro above the resistance of 1.1067 will lead to a larger upward correction and the return of the pair to the area of the maximum of 1.1092, where I recommend taking the profits.
To open short positions on EURUSD, you need:
Bears only have to form a false breakout in the resistance area of 1.1067, which will be the first signal to open short positions in the euro. Weak data on the German foreign trade balance can lead to a breakdown and consolidation below the support of 1.1035, which will increase the pressure on the pair and allow sellers to reach the lows of 1.1004 and 1.0982, where I recommend fixing the profits. If the bears miss the level of 1.1067 in the first half of the day, then do not rush to open short positions. It is best to wait for the resistance update of 1.092 and sell the euro from there immediately on the rebound.
Indicator signals:
Moving Averages
Trading is conducted below 30 and 50 moving averages, which can lead to further downward correction in the pair.
Bollinger Bands
In the case of further decline, the euro will be supported by the lower border of the indicator, located in the area of 1.1035, while the growth will be limited to the middle of the channel in the area of 1.1065.
Description of indicators
- Moving average (moving average determines the current trend by smoothing out volatility and noise). Period 50. The graph is marked in yellow.
- Moving average (moving average determines the current trend by smoothing out volatility and noise). Period 30. The graph is marked in green.
- MACD indicator (Moving Average Convergence / Divergence – moving average convergence / divergence) Fast EMA period 12. Slow EMA period 26. SMA period 9
- Bollinger Bands (Bollinger Bands). Period 20
The material has been provided by InstaForex Company – www.instaforex.com


