
Previous Story
EUR/USD: plan for the European session on Jan 7, 2020
To open long positions on EURUSD you need:
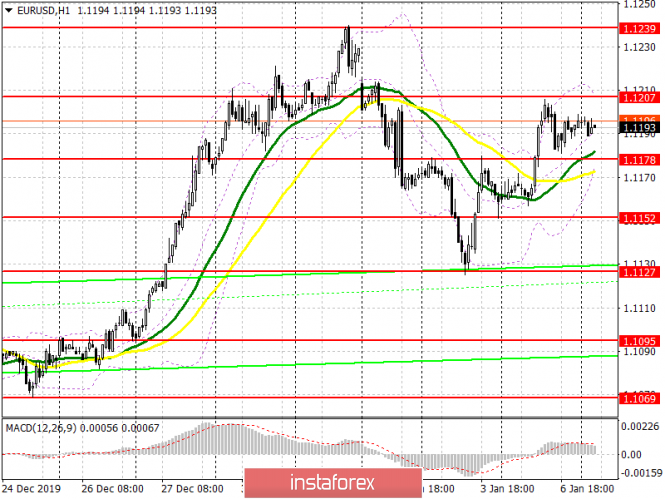
Yesterday’s data on the US services sector caused only a slight downward correction in the pair, but the bulls managed to keep the market under their control. Now a triangle is forming to continue the upward trend, however, this requires a breakthrough of resistance at 1.1207, above which it was not possible to get out yesterday. A breakout of this range will lead EUR/USD to the highs of 1.1239 and 1.1263, where I recommend taking profits. In case the pair declines in the first half of the day, which can happen if the inflation data in the eurozone and retail sales are weak, long positions can be looked at if a false breakout is formed in the support area of 1.1178, or you can buy the euro immediately for a rebound from a low of 1.1152.
To open short positions on EURUSD you need:
Sellers defend the level of 1.1207, however, opening short positions from it today is best after the formation of a false breakout, which can be formed as a result of weak data on inflation in the eurozone, with the growth of which the European Central Bank has problems. In case the euro is under pressure in the region of the level of 1.1207, I recommend considering short positions only after updating the high of 1.1239, or even higher, to rebound from resistance at 1.1263. An equally important task for sellers will be the return of EUR/USD to the support area of 1.1178, which was missed yesterday. Consolidating the pair below this area will increase pressure on the euro, which will return the pair to the lows of 1.1152 and 1.1127, where I recommend taking profits.
Signals of indicators:
Moving averages
Trading is slightly above 30 and 50 moving averages, which preserves the advantage of euro buyers over sellers.
Bollinger bands
If the pair decreases, support will be provided by the lower boundary of the indicator in the region of 1.1178. The upper boundary of the indicator in the area of 1.1207 will act as resistance, a break through which will lead to an increase in the euro.
Description of indicators
- Moving average (moving average determines the current trend by smoothing out volatility and noise). Period 50. The graph is marked in yellow.
- Moving average (moving average determines the current trend by smoothing out volatility and noise). Period 30. The graph is marked in green.
- MACD indicator (Moving Average Convergence / Divergence – moving average convergence / divergence) Fast EMA period 12. Slow EMA period 26. SMA period 9
- Bollinger Bands (Bollinger Bands). Period 20
The material has been provided by InstaForex Company – www.instaforex.com


