
Previous Story
EUR/USD: plan for the European session on Mar 20, 2020
To open long positions on EURUSD you need:
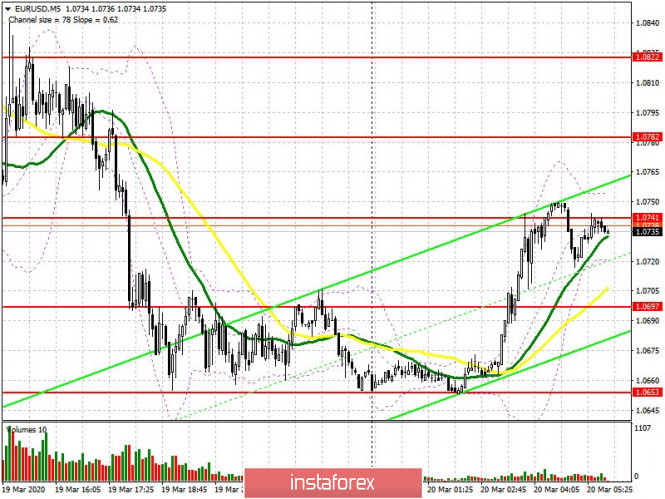
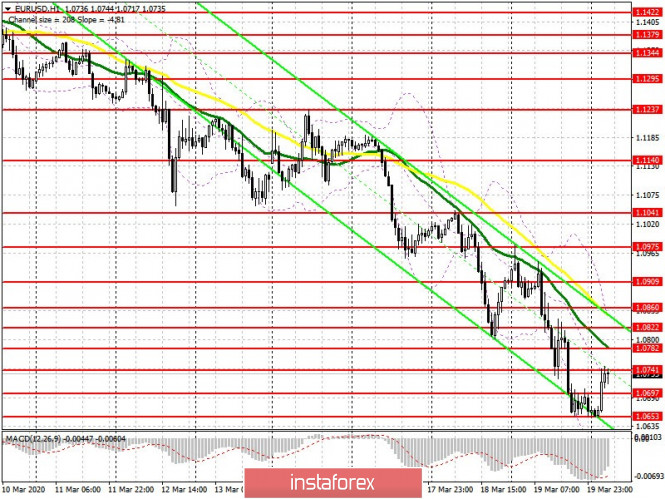
A test of the next major support levels, from which I recommended buying yesterday in anticipation of an upward correction, led to a slight strengthening of the euro against the US dollar today at the Asian session. An increase in Federal Reserve purchases of bonds and a sharp surge in unemployment benefits do not bode well for the future of the market. Currently, buyers will focus on resistance 1.0741, a break and consolidation above which on a 5-minute chart may lead to a continuation of the upward correction to the area of highs 1.0782 and 1.0822, where I recommend taking profit. If the bulls fail to break above 1.0741, it is best to postpone long positions until the support test 1.0697, subject to the formation of a false breakout there, or buy EUR/USD from this month’s low in the 1.0653 area. If there is no activity on the part of the bulls in this range, large players will most likely retreat. In this case, it is best to return to long positions after the euro falls to the lows of 1.0607, 1.0572 and 1.0549.
To open short positions on EUR USD you need:
Bears need to protect the resistance of 1.0741, where the formation of a false breakout will be another signal to open short positions in the expectation of a decline to the lows of 1.0697 and 1.0653. A breakout of these supports will quickly push EUR/USD to new levels of 1.0607 and 1.0572, where I recommend taking profits. Weak reports on inflation in Germany and the balance of the eurozone, which are expected today in the morning, will only worsen the situation of the euro. In case the pair grows above the resistance of 1.0741, it is best to return to short positions after a false breakout in the resistance area of 1.0782, where the moving average passes, or sell EUR/USD immediately to rebound from the highs of 1.0822 and 1.0860.
Indicator signals:
Moving averages
Trading is conducted below 30 and 50 moving averages, which keeps the probability of a further downward trend in the pair.
Bollinger Bands
Growth will be limited to the upper level of the indicator around 1.0822. In case the euro falls, the lower boundary of the indicator in the area of 1.0607 will provide support.
Description of indicators
- Moving average (moving average determines the current trend by smoothing out volatility and noise). Period 50. The graph is marked in yellow.
- Moving average (moving average determines the current trend by smoothing out volatility and noise). Period 30. The graph is marked in green.
- MACD indicator (Moving Average Convergence / Divergence – Moving Average Convergence / Divergence) Fast EMA period 12. Slow EMA period 26. SMA period 9
- Bollinger Bands (Bollinger Bands). Period 20
The material has been provided by InstaForex Company – www.instaforex.com


