
Previous Story
GBP/USD: plan for the European session on Feb 20, 2020
To open long positions on GBP/USD you need:
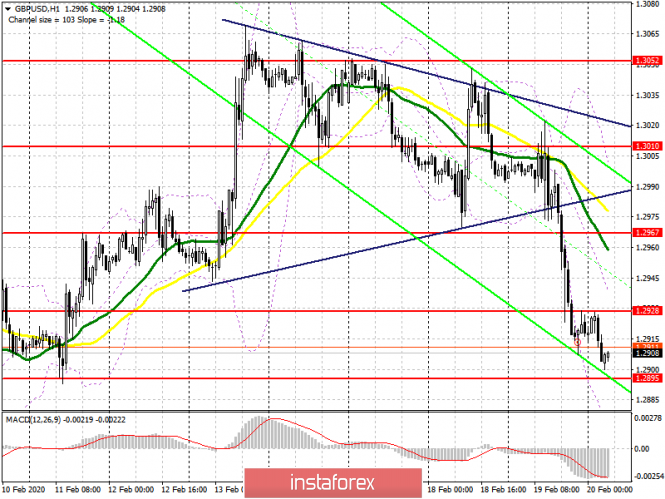
Buyers of the pound today will rely on fundamental data on the volume of retail trade in the UK, judging by the schedule, they have nothing more to hope for. Only a good report will return GBP/USD to the resistance level of 1.2928, which will be a signal to open long positions in the expectation of an increase and update of the resistance of 1.2967, where the moving averages also go. However, I recommend taking profit only after a test of a high of 1.3010. The formation of a false breakout in the support area of 1.2895 after the report will also be a signal to open long positions. In another scenario, just in case the pound falls further, you can count on a rebound from the support of 1.2870, however, larger long positions are best seen after a test of a low of 1.2830.
To open short positions on GBP/USD you need:
Bears yesterday achieved a breakthrough of the lower boundary of the triangle, which I repeatedly paid attention to and quickly returned the pound to a support of 1.2967, which led to the demolition of stop orders of buyers and a quick collapse of the pair. Currently, an important task for sellers is the formation of a false breakout in the resistance area of 1.2928, which will be the first signal to open short positions, and a break of support of 1.2895, which can occur after weak retail sales data in the UK, will push the pound to a low of 1.2870 and 1.2830, where I recommend taking profits. If the bulls manage to pick up resistance at 1.2928 in the morning, then opening new short positions is best after a test of a high of 1.2967, where the moving averages are.
Signals of indicators:
Moving averages
Trading is carried out below 30 and 50 moving average, which saves the likelihood of continued decline in the pound.
Bollinger bands
The pound will be supported by the lower boundary of the indicator at 1.2880, while growth will be limited by the upper level at 1.2980.
Description of indicators
- Moving average (moving average determines the current trend by smoothing out volatility and noise). Period 50. The graph is marked in yellow.
- Moving average (moving average determines the current trend by smoothing out volatility and noise). Period 30. The graph is marked in green.
- MACD indicator (Moving Average Convergence / Divergence – Moving Average Convergence / Divergence) Fast EMA period 12. Slow EMA period 26. SMA period 9
- Bollinger Bands (Bollinger Bands). Period 20
The material has been provided by InstaForex Company – www.instaforex.com


