
Previous Story
GBP/USD: plan for the European session on May 1, 2020
To open long positions on GBP/USD, you need:
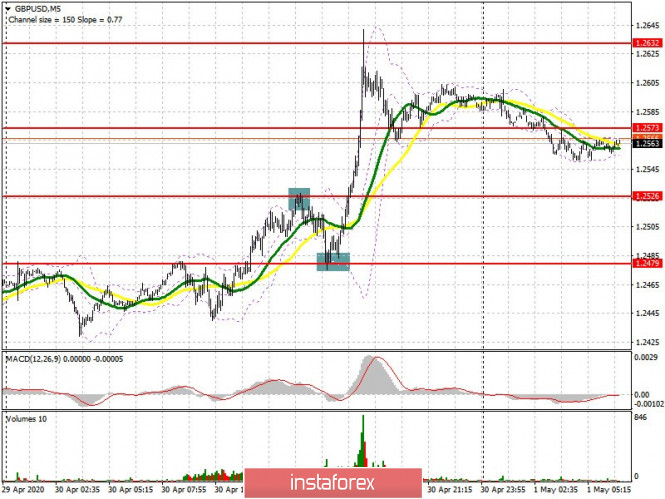
Yesterday, I advised you to open short positions after updating resistance 1.2526 in the morning, and then buy from the 1.2479 level to continue the upward trend in my forecast for the US session. If you look at the 5-minute chart, you can see how the bears fought back from the 1.2526 level, but then a downward correction to the major support of 1.2479 returned buyers to the market, who threw the British pound to the high of 1.2632. This level also resulted in quite good short positions. At the moment, buyers of GBP/USD should break through and consolidate above the resistance of 1.2579, which will lead to a new upward wave in the area of the high of 1.2638, where I recommend taking profits, since it will be quite problematic to break above this range. In case the pound falls in the first half of the day, following the manufacturing activity report in the UK, it is best to consider long positions after a test at 1.2526 by forming a false breakout there, or buy on a rebound from support 1.2479.
To open short positions on GBP/USD, you need:
The market was clearly not on the sellers’ side yesterday, which resulted in an update of the major resistance of 1.2632, where I advised you to sell. At the moment, bears should form a false breakout in the resistance area of 1.2579, after which a larger downward correction could form in the important support area of 1.2526, where I recommend taking profits. However, weaker than forecasted UK manufacturing activity data could bring the British pound to a low of 1.2479, which will mean a reversal of the current upward trend that was formed on April 21. In case of growth above the resistance of 1.2579, it is best to return to short positions on a false breakout from the high of 1.2638, or sell the pound immediately on a rebound from the resistance of 1.2686.
Signals of indicators:
Moving averages
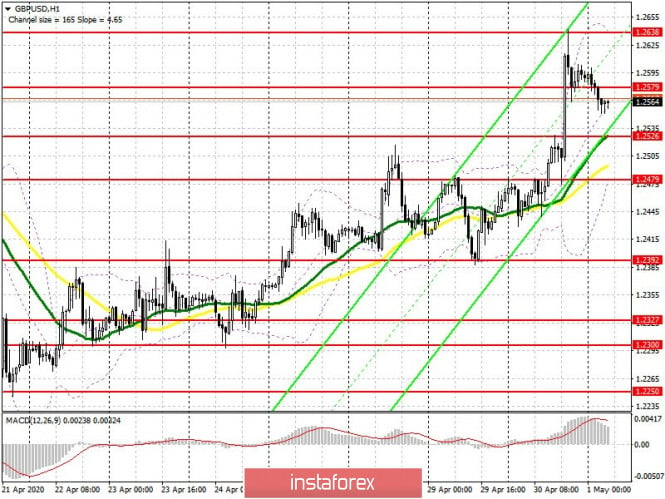
Trading is conducted above 30 and 50 moving average, which implies a continuation of the upward trend.
Note: The period and prices of moving averages are considered by the author on the hourly chart H1 and differs from the general definition of the classic daily moving averages on the daily chart D1.
Bollinger bands
If the pound declines, support will be provided by the lower border of the indicator at 1.2510. Growth will be limited by the upper level of the indicator at 1.2635.
Description of indicators
- Moving average (moving average determines the current trend by smoothing out volatility and noise). Period 50. The graph is marked in yellow.
- Moving average (moving average determines the current trend by smoothing out volatility and noise). Period 30. The graph is marked in green.
- MACD indicator (Moving Average Convergence / Divergence – moving average convergence / divergence) Fast EMA period 12. Slow EMA period 26. SMA period 9
- Bollinger Bands (Bollinger Bands). Period 20
The material has been provided by InstaForex Company – www.instaforex.com


