
Previous Story
Technical analysis of the GBP/USD pair for the week of May 18-23, 2020
Trend analysis:
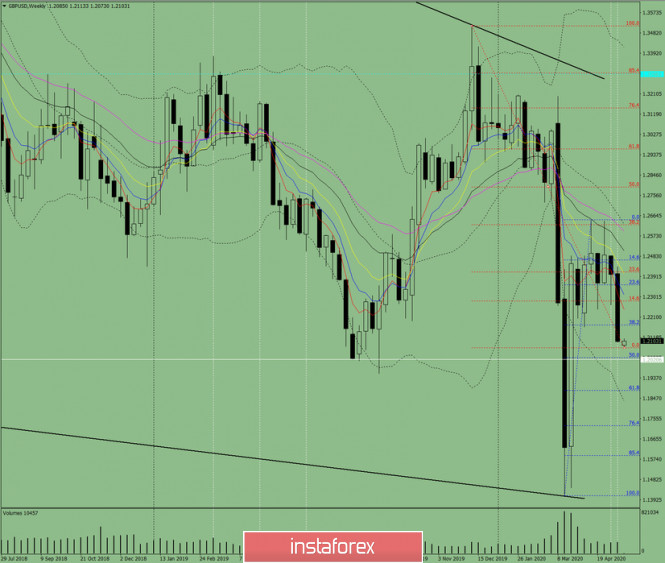
This week, the price from the level of 1.2100 (closing of the last weekly candlestick) will move up with the target at 1.2282 – a pullback level of 14.6% (red dashed line), and in case of testing this level, work up with the next upper target at 1.2412 – a pullback level of 23.6% (red dotted line). In case of breaking through this level, the next target will be at 1.2623 – a pullback level of 38.2% (red dashed line).
Fig. 1 (weekly schedule).
Comprehensive analysis:
– indicator analysis – up;
– Fibonacci levels – up;
– volumes – up;
– candlestick analysis – down;
– trend analysis – down;
– Bollinger Lines – down;
– monthly chart – up.
The conclusion of a comprehensive analysis is an upward movement.
The total result of calculating the candle of the GBP/USD currency pair according to the weekly chart: the price of the week will most likely have an upward trend with the absence of the first lower shadow of the weekly white candlestick (Monday – up) and the presence of the second upper shadow (Friday – down).
The first upper target at 1.2282 is a pullback level of 14.6% (red dashed line).
The weekly upper target at 1.2412 is a pullback level of 23.6% (red dashed line).
An unlikely scenario: the price from the level of 1.2100 (closing of the last closed weekly candle) working down with the lower target of 1.1883 – the lower border of the Bollinger line indicator (black dashed line).
The material has been provided by InstaForex Company – www.instaforex.com
Source:: Technical analysis of the GBP/USD pair for the week of May 18-23


